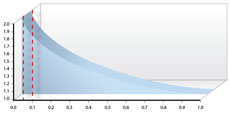
 Odds Ratios and Risk Ratios
Again, I have to admit that I am not a biostatistician or a numbers guy. If anything, I am exactly the opposite. When taking my initial six month biostatistics course (twenty years ago!), our professor warned us never to do any math in our heads. That was a great consolation, because I am very poor at mathematics. But I am very fascinated with the power of numbers to be able to tell a story about circumstances and disease, risk factors and predictions of disease, etc. In this recent series, we have been discussing statistics from a clinician's viewpoint – trying to simplify concepts that can ostensibly be quite daunting. Nonetheless, these statistical concepts are essential to comprehend if your are to be educated consumers of the medical literature.
Our final concept will be as important as any other for our purposes as clinicians – that of the Odds Ratio (OR) and Risk Ratio (RR). You see these ratios reported in most comparative studies, observational studies, and certainly in every clinical trial. They are very important measures of association between putative risk factors and diseases or outcomes of interest. While sometimes considered fairly equivalent in predicting associations between risk factors and disease, there are subtle differences between them. To understand the ratios, we must first understand what is being compared in each: odds and risks. Let's first start with Risk , since it is easier to understand. In my mind, risk is synonymous with probability, proportion, percentage, and chance. It's a simple proportion or percentage (hasn't it been that way throughout our lessons?). The numerator is the number of persons with the disease or risk factor of interest and the denominator is the total number of persons under study (study population). Let's use a common example to clarify things: if we have a cohort of 100 smokers, 40 of whom died from coronary artery disease (CAD) and want to determine the risk of fatal CAD in smokers, the risk (in our population) is 40 /100 or 40%. Next, we want to assess the same risk in a cohort of 100 non-smokers, 20 of who died in our study period. Therefore, the risk of fatal CAD in non-smokers would be 20/100 or 20%. Comparing the risks for fatal CAD between these two populations will result in the risk for CAD in smokers relative to nonsmokers – this is theRelative Risk (RR) . In the example above, the RR is simply the proportion .40/.20 or 2. This implies that smokers have twice the risk for CAD as do non-smokers. Relative risk is exactly as it implies: the risk of disease in persons "exposed" to a risk factor compared (relative to) the risk of that disease in persons without that particular factor (unexposed). Any ratio (RR) with a result greater than 1 (no difference in risk) are implied to have a greater risk for the disease. Conversely, when the numerator (exposed persons) is less than the denominator (unexposed), the RR must have a value less than 1 (example: 25/50= .5). This is consideredprotective against the disease, since the risk is smaller in the exposed group than it is in the "unexposed" or reference population. Unless you are a gambler, odds are a little more difficult to understand. In statistics, the odds of an event occurring is the probability of the event occurring (p) divided by the probability of an event not occurring (1-p). This is noted by the equation p/(1-p). Considering odds, we must ask how likely an event will occur compared to the likelihood that it will not occur. The classic example is a coin toss where the probability of "heads" is 50% (p) as is the probability of tails (1-p). Therefore the odds of a coin flip being heads equals 50%/50%= 1. If the probability of an event occurring is 75% (p), then the probability of it not occurring is 25% (1-p); the odds of it occurring are then 3 (75/25). The Odds Ratio (OR) is simply the comparison of odds in one group compared to a reference group, i.e., the odds of disease in an exposed group (p/ 1-p) compared to the odds of disease in an unexposed group (p0/1-p0). The formula is simply : p/( 1-p ) / p0/( 1-p0 ) Many studies that we read report odds ratios as measures of association between hemoglobin A1c and risk for infection or peripheral arterial disease for amputation or neuropathy for "risk" of developing Charcot joints. Logistic regression, a means to assess numerous risk factors for their association with outcomes of interest, will always report ORs for each risk factor (variable) of interest. Although we can consider ORs as "risk" for disease or outcome, we need to recognize that this is true only when the odds and risks are small. Nonetheless, we can always safely say that when an OR is greater than 1, the probability of event "p" (exposed group) is more likely to occur than is that event in the unexposed group (p0). Conversely, when an OR is less than 1 (equality), we know that the exposed group is protected from the outcome relative to the unexposed group. If an OR= 2.3, we know that persons with the variable of interest have a 2.3-fold greater risk (or likelihood) of developing the outcome of interest. An OR=.75 means that the exposed population has a 25% risk reduction for developing the outcome compared to the reference (unexposed) population. That's probably enough for now. We will discuss this further in next month's ezine so that we can take examples from our literature to explore the utility of Odds Ratios and their importance to our understanding of risk for disease. Again, the Power of Numbers can tell us so much!
Robert Frykberg, DPM, MPH
Suggested References:
|


